Suburb snapshot · 2020–2026
Bondi Beach: the six-year street-level snapshot
Median price, volume, and every street with two or more verified sales, houses and units, 2020–2026.
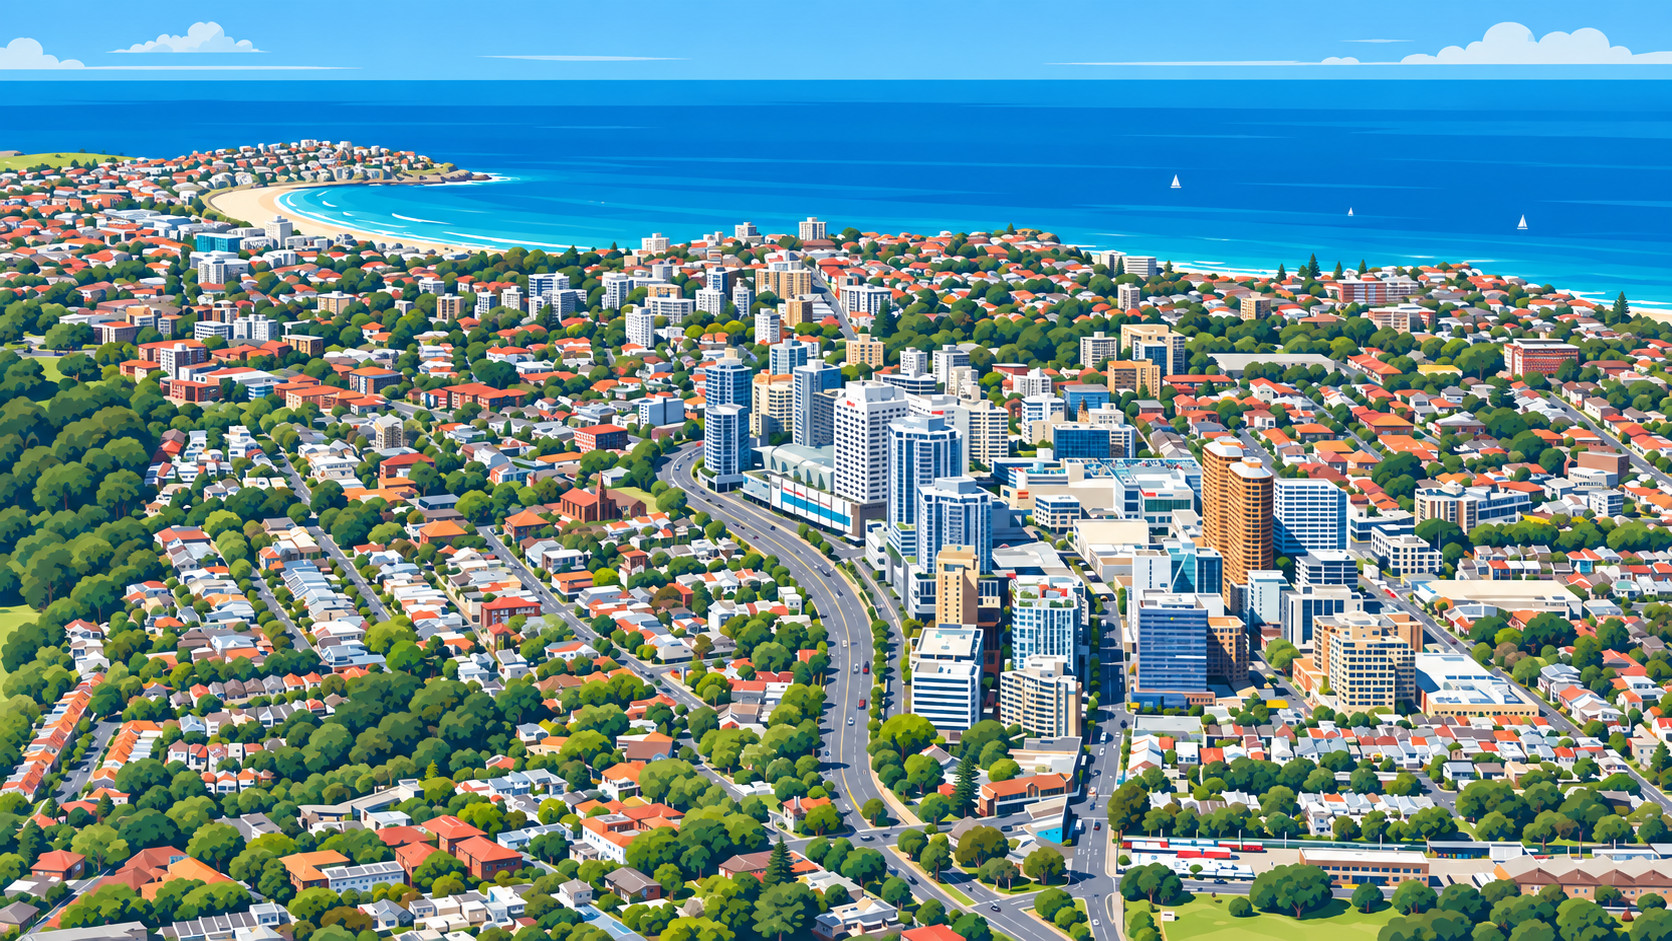
Bondi Beach posted the highest house median of the beachside suburbs in 2025 — $4.86 million, up from $2.93 million in 2020 — before easing to $4.34 million this year. Unit volume here runs well ahead of house volume every single year, reflecting a suburb built overwhelmingly on strata stock close to the sand.
Median sale price by year, Bondi Beach, houses vs units. Source: property sales register, verified prices only.
Unit sales outnumbered house sales by roughly six to one, every year, without exception. This is a strata suburb first and a house suburb a distant second.
Reading the street data
Unit turnover in Bondi Beach is genuinely deep: Campbell Parade alone recorded 187 verified sales at a $2.0 million median, the beachfront premium clearly visible against the suburb’s broader unit figures. Curlewis Street (133 sales) and Wellington Street on the house side round out the suburb’s most liquid, most reliably priced addresses — the kind of trading depth that makes a street median genuinely trustworthy rather than a guess from a handful of sales.
Houses — every street with two or more sales
| Street | Sales | Average | Bottom sale | Top sale |
|---|---|---|---|---|
| Wellington Street | 23 | $3.85M | $1.89M | $8.50M |
| Lamrock Avenue | 17 | $4.00M | $1.75M | $11.25M |
| Simpson Street | 15 | $3.80M | $2.60M | $7.60M |
| Rickard Avenue | 13 | $4.05M | $2.17M | $5.42M |
| O’Brien Street | 12 | $4.01M | $2.52M | $6.00M |
| Glasgow Avenue | 11 | $4.10M | $2.45M | $4.97M |
| Roscoe Street | 11 | $4.08M | $3.12M | $23.50M |
| Francis Street | 10 | $4.33M | $3.12M | $5.30M |
| Warners Avenue | 9 | $5.25M | $3.63M | $8.60M |
| Beach Road | 7 | $4.72M | $3.73M | $7.70M |
| Cox Avenue | 7 | $4.15M | $3.40M | $12.10M |
| Curlewis Street | 7 | $4.30M | $2.20M | $22.50M |
| Hall Street | 7 | $5.20M | $2.75M | $21.00M |
| Chambers Avenue | 6 | $3.79M | $3.70M | $5.06M |
| Edward Street | 5 | $4.70M | $2.25M | $5.67M |
| Forest Knoll Avenue | 5 | $4.25M | $2.93M | $8.00M |
| Barracluff Avenue | 4 | $3.21M | $2.93M | $5.30M |
| Brighton Boulevard | 4 | $4.62M | $3.50M | $5.50M |
| Old South Head Road | 4 | $3.50M | $2.75M | $6.80M |
| Ormond Street | 4 | $8.62M | $5.52M | $10.00M |
| Ramsgate Avenue | 4 | $5.85M | $4.00M | $12.95M |
| Sir Thomas Mitchell Road | 4 | $5.80M | $5.22M | $6.40M |
| Blair Street | 3 | $3.05M | $1.30M | $6.00M |
| Consett Avenue | 3 | $8.20M | $3.80M | $9.25M |
| Hastings Parade | 3 | $4.67M | $2.83M | $6.20M |
| Bondi Road | 2 | $3.40M | $3.00M | $3.80M |
| Campbell Parade | 2 | $10.50M | $6.00M | $15.00M |
| Glenayr Avenue | 2 | $3.63M | $3.36M | $3.90M |
| Jaques Avenue | 2 | $6.83M | $4.25M | $9.40M |
29 qualifying house streets, Bondi Beach, 2020–2026. “Average” is the median sale price; “bottom” and “top” are the lowest and highest verified sales recorded on that street.
Units — every street with two or more sales
| Street | Sales | Average | Bottom sale | Top sale |
|---|---|---|---|---|
| Campbell Parade | 187 | $2.00M | $420K | $23.00M |
| Curlewis Street | 133 | $1.11M | $410K | $6.33M |
| Francis Street | 110 | $1.46M | $662K | $8.25M |
| Hall Street | 103 | $1.92M | $625K | $21.90M |
| Beach Road | 101 | $1.26M | $100K | $2.90M |
| Ramsgate Avenue | 77 | $1.29M | $550K | $5.00M |
| O’Brien Street | 68 | $1.50M | $600K | $2.60M |
| Wellington Street | 65 | $1.60M | $52K | $6.62M |
| Roscoe Street | 60 | $1.23M | $825K | $9.10M |
| Glenayr Avenue | 49 | $1.09M | $500K | $4.25M |
| Sir Thomas Mitchell Road | 47 | $1.47M | $570K | $8.20M |
| Jaques Avenue | 45 | $1.64M | $150K | $3.05M |
| Lamrock Avenue | 40 | $1.88M | $850K | $4.14M |
| Brighton Boulevard | 34 | $2.29M | $1.06M | $5.31M |
| Simpson Street | 31 | $1.53M | $770K | $2.80M |
| Gould Street | 28 | $1.11M | $375K | $3.21M |
| Notts Avenue | 28 | $6.00M | $255K | $24.00M |
| Edward Street | 27 | $1.65M | $150K | $3.67M |
| Old South Head Road | 19 | $1.48M | $1.10M | $3.38M |
| Lucius Street | 18 | $1.25M | $555K | $1.71M |
| Warners Avenue | 17 | $1.62M | $365K | $7.75M |
| Hastings Parade | 10 | $1.16M | $800K | $3.40M |
| Blair Street | 9 | $1.00M | $810K | $2.02M |
| Ormond Street | 8 | $1.02M | $588K | $1.37M |
| Forest Knoll Avenue | 7 | $1.95M | $780K | $3.80M |
| Cox Avenue | 6 | $1.03M | $920K | $2.00M |
| Consett Avenue | 4 | $1.89M | $900K | $2.92M |
| Glasgow Avenue | 3 | $2.50M | $2.30M | $3.60M |
| Mitchell Street | 3 | $1.30M | $1.20M | $1.50M |
| Bondi Road | 2 | $1.88M | $1.75M | $2.00M |
| Chambers Avenue | 2 | $1.43M | $1.35M | $1.51M |
31 qualifying unit streets, Bondi Beach, 2020–2026. “Average” is the median sale price; “bottom” and “top” are the lowest and highest verified sales recorded on that street.
Campbell Parade’s premium isn’t subtle. It’s the difference between a beachfront address and everywhere else in the postcode.
If you’re weighing up a sale on one of these streets, the suburb median only gets you so far. I price every appraisal against what that specific street has actually done — not just this year, but across the full cycle.
Want the read on your street in Bondi Beach?
I price every appraisal against the street-level record, not just the suburb average.
Request a free appraisal Begin a conversationThis article is based on publicly available property transaction data believed accurate as at the date of publication. It is provided for general information only and does not constitute financial, investment or legal advice. Past sale prices and market trends are not a guarantee of future performance. Readers considering a property decision should seek independent professional advice specific to their circumstances.