
Market analysis
A Sydney house bought in 2006 has more than tripled. A unit bought the same year has a little more than doubled. The gap between them is the most important story in Sydney property — and in the Eastern Suburbs, it plays out differently.
I have sold property in Sydney’s Eastern Suburbs for more than three decades. Clients often ask me some version of the same question: is property still a good investment? The honest answer is that it depends on what you own — and where. The last twenty years show that more clearly than any period I can remember.
The headline
In late 2006, the typical Sydney house sold for about $521,500. Today it sits at $1.73 million. That is an increase of roughly 232% — about 6.2% a year compounded, and around $60,000 of value added every year for two decades.
Units did well too, but not as well. The typical unit rose from about $356,400 to $849,068. That is an increase of 138%, or about 4.4% a year.
On their own, both numbers look healthy. Put them side by side and a different picture emerges.
Two decades, not one
The first decade treated both property types well. Between 2006 and 2016, houses compounded at about 8% a year and units at about 7%. For most of that period, owners of either could reasonably expect their property to roughly double in ten years.
The second decade broke that pattern. Since the end of 2016, houses have grown at about 4.7% a year. Units have grown at under 2%. After allowing for inflation, many unit owners have spent the past decade standing still.
Why it happened
The explanation is simple, and it is permanent. Sydney is hemmed in by ocean, national park and distance. We cannot make more land close to the city, and land is what appreciates.
A building depreciates over time. The block beneath it does not.
A house is mostly land. A unit is mostly building, with a small share of land. When land becomes scarcer, houses capture that scarcity and units largely don’t.
Supply compounded the effect. The 2010s brought an apartment construction boom, and every new tower added competition for existing unit owners. Detached housing close to the city saw no such wave.
The result is a record gap. In 2006, a house cost about one and a half times a unit. Today it costs about twice as much.
The cycles along the way
None of this happened in a straight line. In 2006, the market was still recovering from a 10% fall off the 2003 peak. It then ran hard through the mid-2010s, corrected between 2017 and 2019, surged through 2021, and climbed again until early this year.
We are now at another turning point. In the June quarter of 2026, Sydney house prices fell 3.3% — the first quarterly decline in three and a half years, and the largest of any capital city. Units eased 1.5%.
In my assessment, this is a cycle turning, not a structure breaking. Borrowing capacity and affordability have hit their limits for now. The land constraint that drove twenty years of house outperformance has not changed.
Our own streets
The Eastern Suburbs — twenty years, property by property
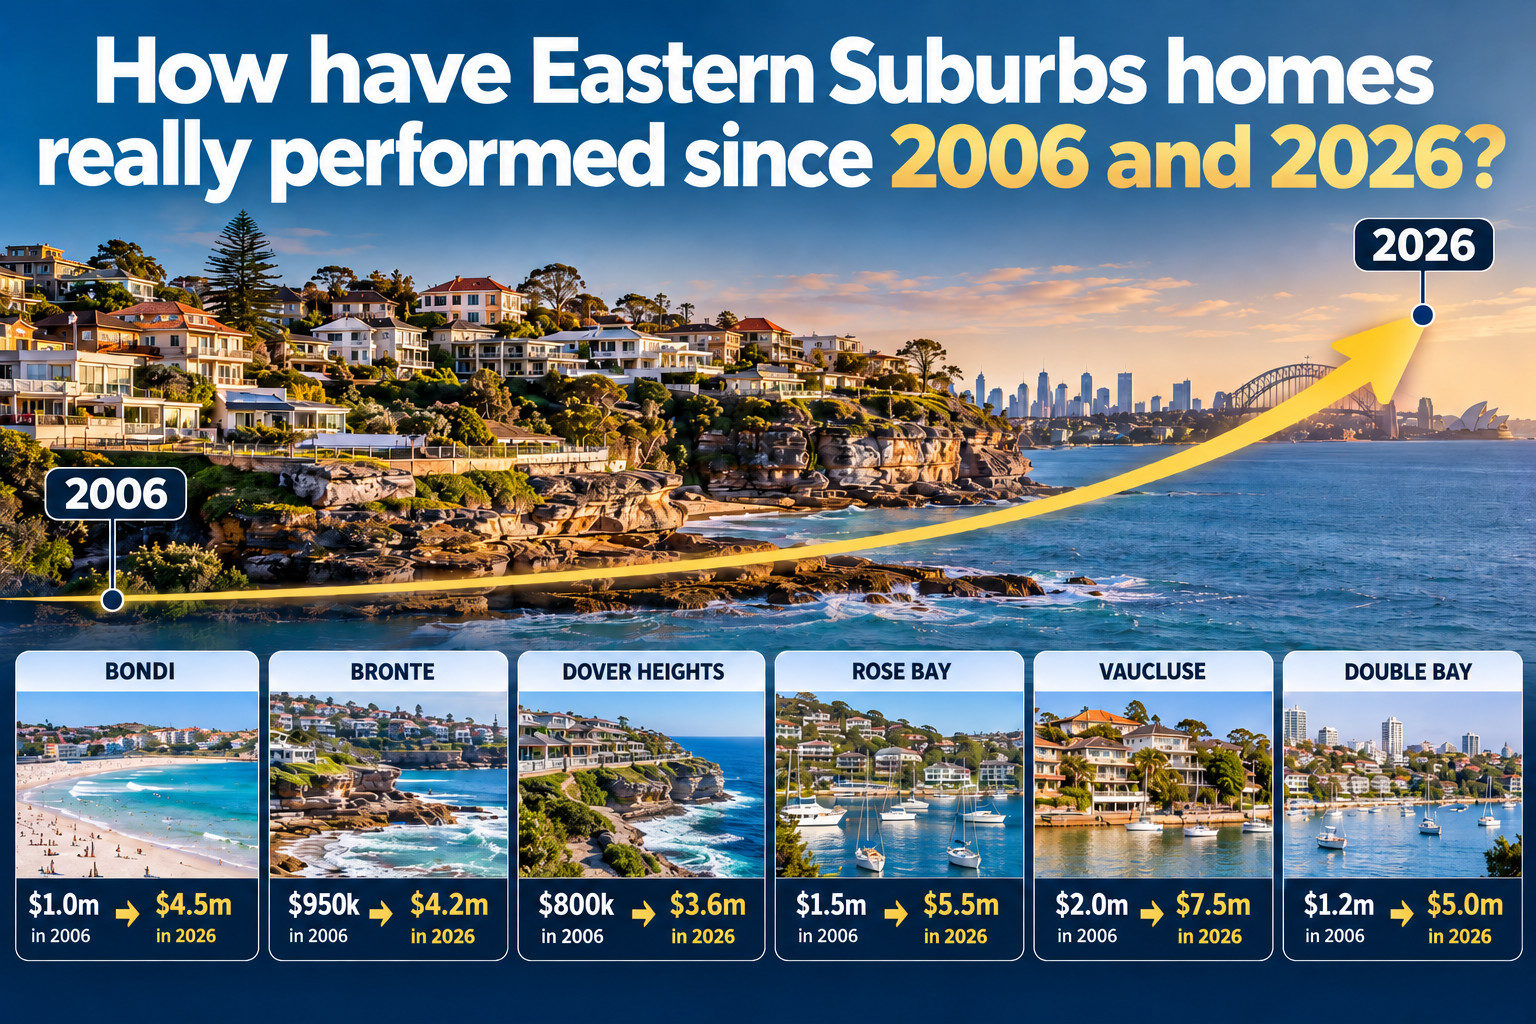
City-wide medians tell one story. Our own streets tell a sharper one. To see it clearly, I went back to every Waverley and Woollahra property that sold in 2006, then looked for the same homes selling again. Close to 1,800 did. Comparing a property with itself removes the usual noise about which homes happened to sell in a given quarter.
Both councils beat Sydney as a whole, and in both, houses beat units. But the gap between them was far narrower than across the city. Waverley houses compounded at 7.2% a year against 6.2% for units. In Woollahra it was 6.3% against 5.6%. City-wide, units have trailed houses by almost two points a year.
Waverley
Houses
The typical Waverley house cost about $1.12 million in 2006, and has grown at 7.2% a year since. Houses held right through to 2024–26 sold for close to four times their purchase price.
| Suburb | Typical 2006 price | Growth a year | Resales |
|---|---|---|---|
| Bondi | $925,000 | 7.3% | 28 |
| Bondi Beach | $1,060,000 | 7.9%* | 18 |
| Bondi Junction | $830,000 | 7.4% | 51 |
| Bronte | $1,512,500 | 7.3% | 30 |
| Dover Heights | $2,300,000 | 4.9% | 26 |
| North Bondi | $1,275,000 | 7.5% | 49 |
| Queens Park | $1,210,000 | 6.8% | 41 |
| Tamarama | $2,455,000 | 7.1%* | 8 |
| Waverley | $1,110,000 | 7.2% | 25 |
* Fewer than 20 resales. Indicative only.
A four-bedroom family home in North Bondi, bought for just under $1 million, sold last year for $3.8 million — although, like many Eastern Suburbs homes, it had been renovated along the way.
Units
The typical Waverley unit cost about $505,000 in 2006 and has grown at 6.2% a year. Long-held units sold for about 2.8 times their purchase price. North Bondi and Bondi Beach produced the strongest unit results of the whole study.
| Suburb | Typical 2006 price | Growth a year | Resales |
|---|---|---|---|
| Bondi | $499,900 | 6.0% | 109 |
| Bondi Beach | $515,000 | 6.6% | 169 |
| Bondi Junction | $511,500 | 5.8% | 66 |
| Bronte | $505,000 | 6.3% | 47 |
| Dover Heights | $615,000 | 5.6%* | 11 |
| North Bondi | $525,000 | 6.8% | 63 |
| Queens Park | $500,000 | 5.4% | 30 |
| Tamarama | $630,000 | 5.8%* | 17 |
| Waverley | $465,000 | 5.7% | 21 |
* Fewer than 20 resales. Indicative only.
A two-bedroom Art Deco apartment one block back from Bondi Beach cost $431,000 in 2006. It sold this year for a little over $1.3 million.
Woollahra
Houses
Woollahra started from a higher base. The typical house cost about $1.65 million in 2006 and has grown at 6.3% a year. Long-held houses sold for about 3.3 times their purchase price. Rose Bay matched the best of the beaches, and Bellevue Hill was close behind.
| Suburb | Typical 2006 price | Growth a year | Resales |
|---|---|---|---|
| Bellevue Hill | $3,200,000 | 7.0% | 49 |
| Darling Point | $4,010,000 | 5.4%* | 9 |
| Double Bay | $1,995,000 | 5.7% | 22 |
| Edgecliff | $828,000 | 5.4%* | 7 |
| Paddington | $1,159,500 | 6.3% | 136 |
| Point Piper | $5,175,000 | 4.4%* | 6 |
| Rose Bay | $1,700,000 | 7.5% | 36 |
| Vaucluse | $2,750,000 | 6.3% | 57 |
| Watsons Bay | $3,150,000 | 5.5%* | 6 |
| Woollahra | $1,600,000 | 6.3% | 65 |
* Fewer than 20 resales. Indicative only.
A Victorian terrace in Paddington, near Queen Street, changed hands for $1.675 million in 2006 and $5.7 million last year.
Units
The typical Woollahra unit cost about $592,000 in 2006 and has grown at 5.6% a year — the narrowest house–unit gap in the study. Double Bay stands out: its units outpaced its houses, which fits the steady demand I see from owners stepping down into a well-located, lock-up-and-leave apartment.
| Suburb | Typical 2006 price | Growth a year | Resales |
|---|---|---|---|
| Bellevue Hill | $557,000 | 5.7% | 113 |
| Darling Point | $1,110,000 | 5.3% | 59 |
| Double Bay | $622,500 | 6.1% | 66 |
| Edgecliff | $435,000 | 5.3% | 40 |
| Paddington | $500,000 | 5.8% | 60 |
| Point Piper | $1,310,000 | 6.0%* | 11 |
| Rose Bay | $599,000 | 5.6% | 122 |
| Vaucluse | $527,500 | 5.5% | 52 |
| Woollahra | $580,500 | 5.4% | 72 |
* Fewer than 20 resales. Indicative only.
A two-bedroom apartment in an Edgecliff Art Deco block went from $460,000 to $1.325 million last October — almost three times the price, with nothing changed but time.
What the suburbs have in common
In both councils, the suburbs that were cheapest to enter in 2006 generally grew fastest in percentage terms, and the most expensive grew slowest. In dollars, the prestige addresses still added the most. But for a buyer deciding where the next dollar goes, the entry point matters as much as the postcode.
Land still wins. In the Eastern Suburbs, though, scarcity also extends to the right apartment in the right block.
A generic unit elsewhere in Sydney has been a weak asset for a decade. A good one here has not.
What it means for owners
For owners of freestanding homes, the long-run case is intact. Over any reasonable holding period, land in a landlocked city has rewarded patience. A soft quarter matters mainly for timing and presentation, not for the underlying asset.
For unit owners, the lesson is subtler. Not all units are equal. Boutique blocks, a generous land share, low supply nearby and a location that genuinely can’t be replicated have held value far better than the city-wide average suggests.
For anyone weighing a move — downsizing, upsizing or selling to buy — the relative price matters more than the absolute one. When the gap between houses and units is at a record, the cost of stepping up is at its highest. So is the benefit of stepping down.
A closing thought
Twenty years of data won’t tell you what next quarter holds. It does tell you what has mattered: land, scarcity and patience. Those are still the things I look for first.
What is your home worth today?
Know where you stand before you decide
If you bought in the Eastern Suburbs years ago, the numbers above may understate — or overstate — what your own property has done. I’m happy to look at it with you, at your home or a local café.
Methodology and sources
- Greater Sydney figures: Domain House Price Reports (December 2016, September 2019, June 2021, September 2024, September 2025, June 2026), which use stratified medians. The 2006 starting point is the REIA moving annual median for the December quarter 2006, a different method, and the 2009 point is derived from Domain’s ten-year comparison. Growth rates are Weiss Real Estate calculations.
- Eastern Suburbs figures: Weiss Real Estate analysis of recorded sales in the Waverley and Woollahra council areas. Every property sold in 2006 was matched with later sales of the same address. Growth is the median compound annual rate from the 2006 purchase to the most recent resale.
- Excluded: duplicate records, undisclosed prices, nominal transfers under $100,000, resales within two years, likely part-interest or knock-down sales, whole-building transactions and development sites. Of 1,992 matched properties, 1,799 were used.
- Council areas are mapped by suburb and are approximate: Paddington is shared with the City of Sydney, and small parts of Rose Bay and Vaucluse sit in Waverley.
- Repeat sales do not adjust for renovation between sales, which is likely to flatter house growth slightly relative to units. Only properties that resold are included.
This article is general commentary based on historical data and my own professional assessment. It is not financial advice. Past performance does not guarantee future results.
