Building analysis · Bondi Junction
The bigger the building, the worse the median
Two hundred sales across Eclipse, The Oscar and Eastgate Gardens — and a pattern that should change how you read a price guide.
Three towers dominate the residential skyline of Bondi Junction. Between them they hold well over five hundred apartments, and between them they have generated two hundred recorded sales that I have now been through line by line. Each building has already had its own study. Putting them side by side turns out to say something none of them says alone.
The finding is simple enough to state in a sentence, and uncomfortable enough that I want to show the working. The larger the building, the less its median price tells you about any apartment inside it. Not slightly less. Dramatically less.
The three buildings
They were built roughly a decade apart, by different developers, to different codes and different assumptions about how people would live. That is what makes the comparison useful.
Eclipse, 1 Adelaide Street Completed 2001 · Walker Corporation · 87 lots · SP65372
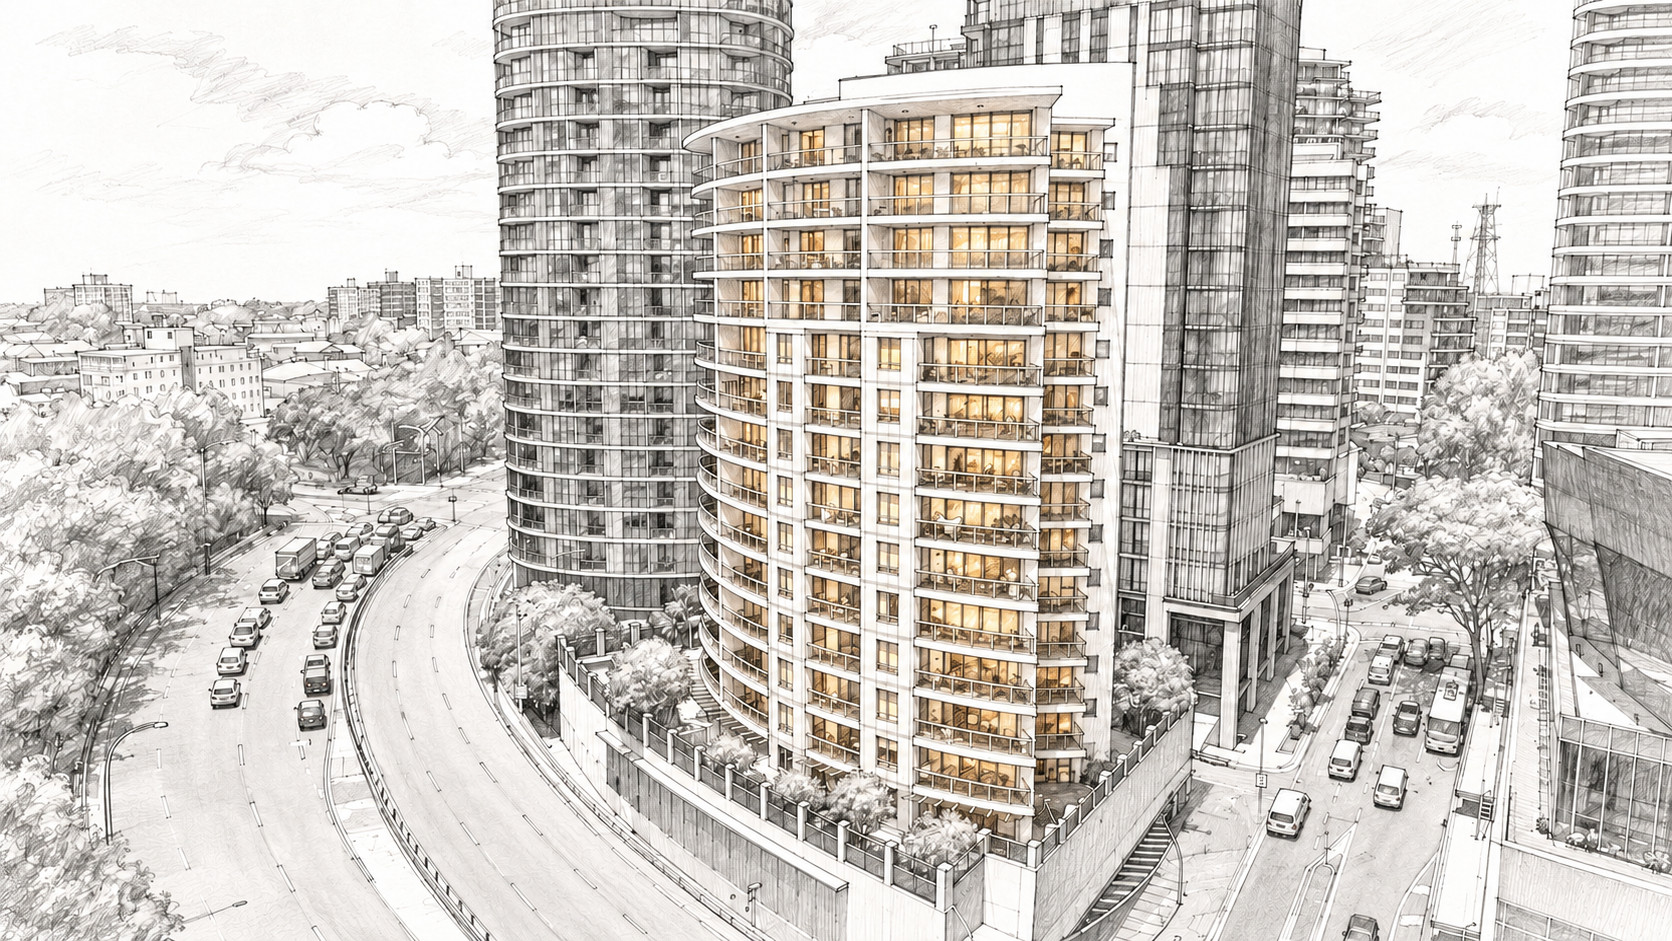
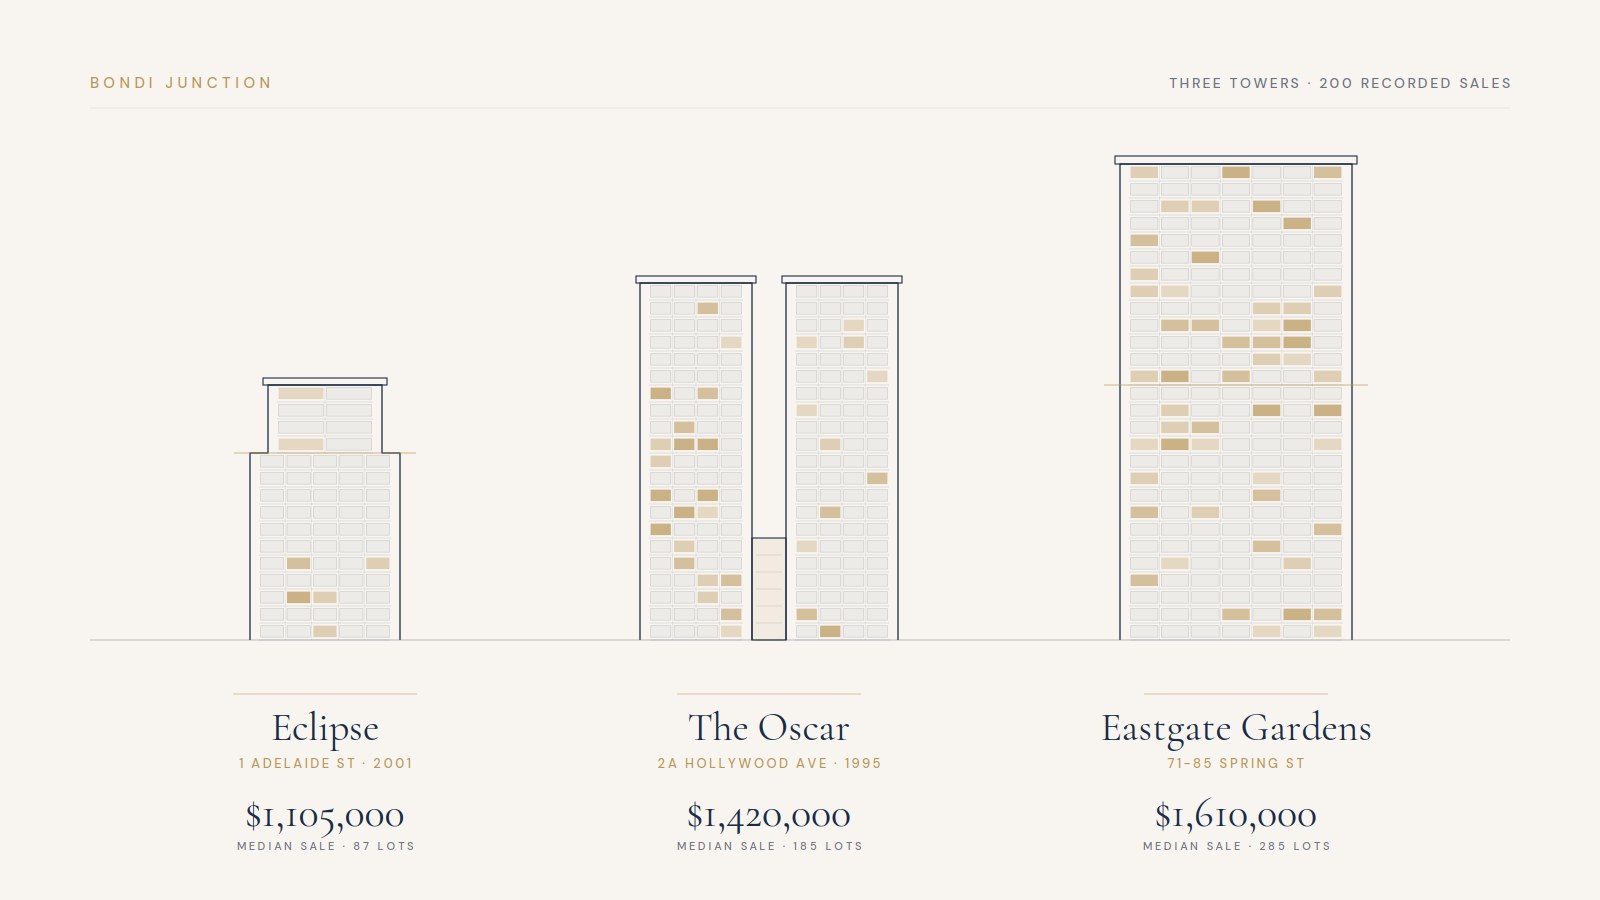
The smallest and newest of the three, and the tightest. Thirty-three recorded sales run from $920,000 to $2,850,000, with a median of $1,105,000. The building’s defining feature is a taper: the floor plate narrows above level eleven, so the upper tower is not the lower tower with a better view — it is a different building, with fewer and wider apartments. Full study: Eclipse — what twenty-five years has actually proved.
The Oscar, 2A Hollywood Avenue Completed 1995 · Meriton · approx. 185 lots · SP50442
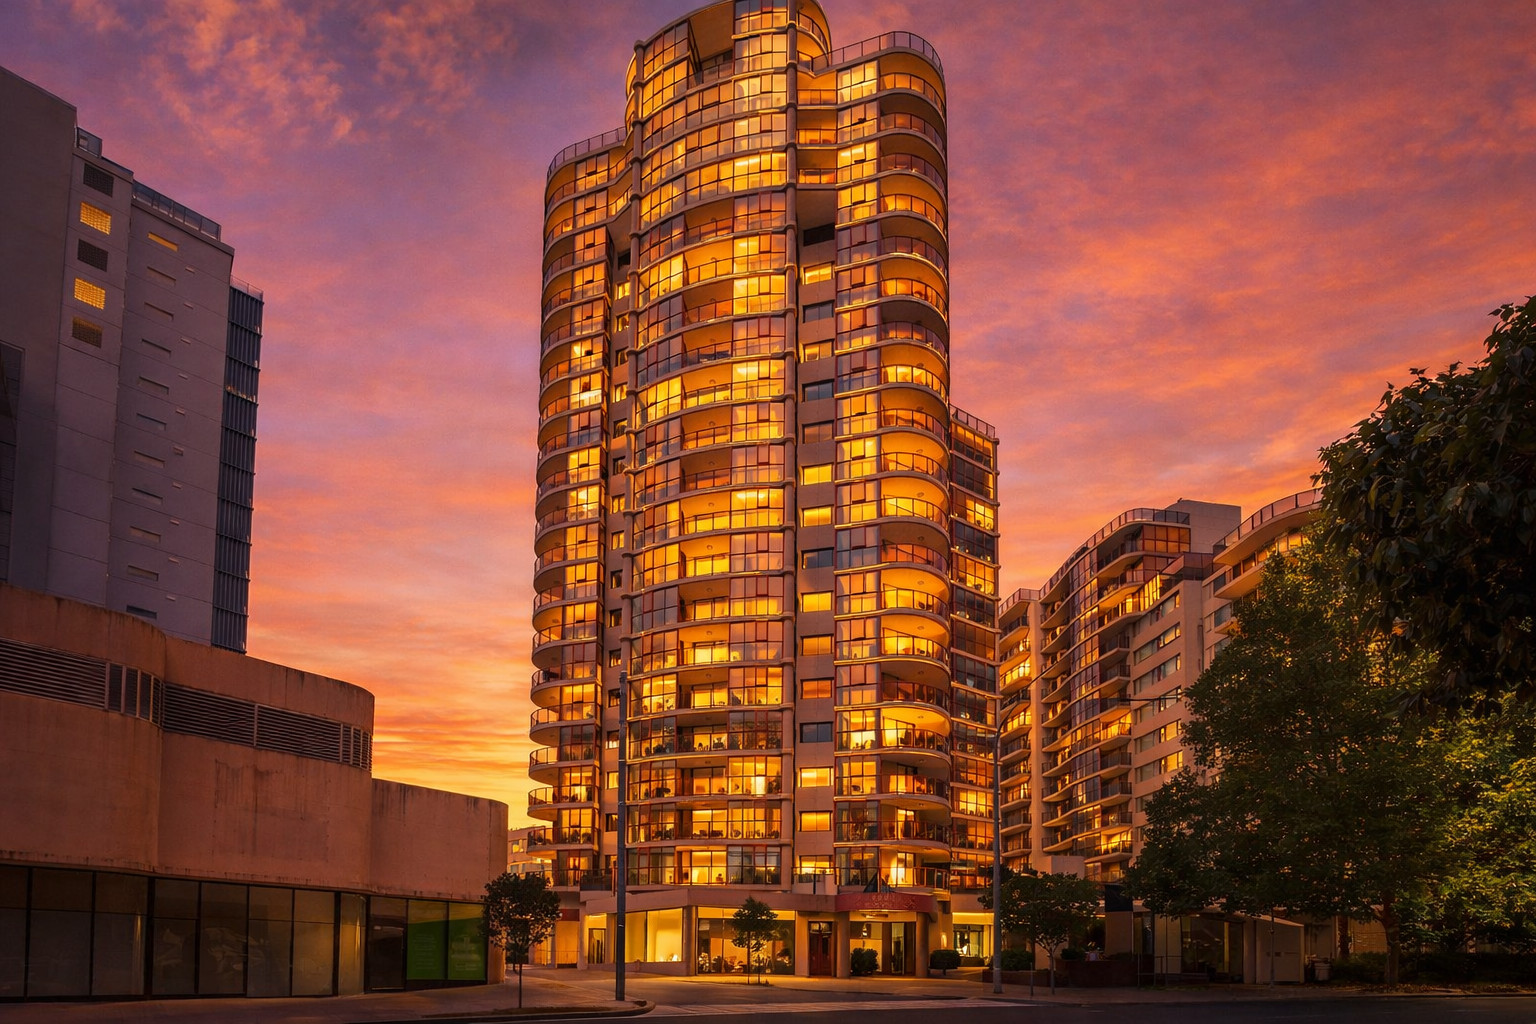
Two towers presented to the market as two addresses and held on title as one scheme. Fifty-nine sales run from $800,000 to $4,800,000, median $1,420,000. The 1995 floor plates are generous by current standards, which is the reason the larger apartments here keep drawing downsizers away from new stock. Full study: One address, six price brackets.
Eastgate Gardens, 71-85 Spring Street Approx. 285 lots · SP31023
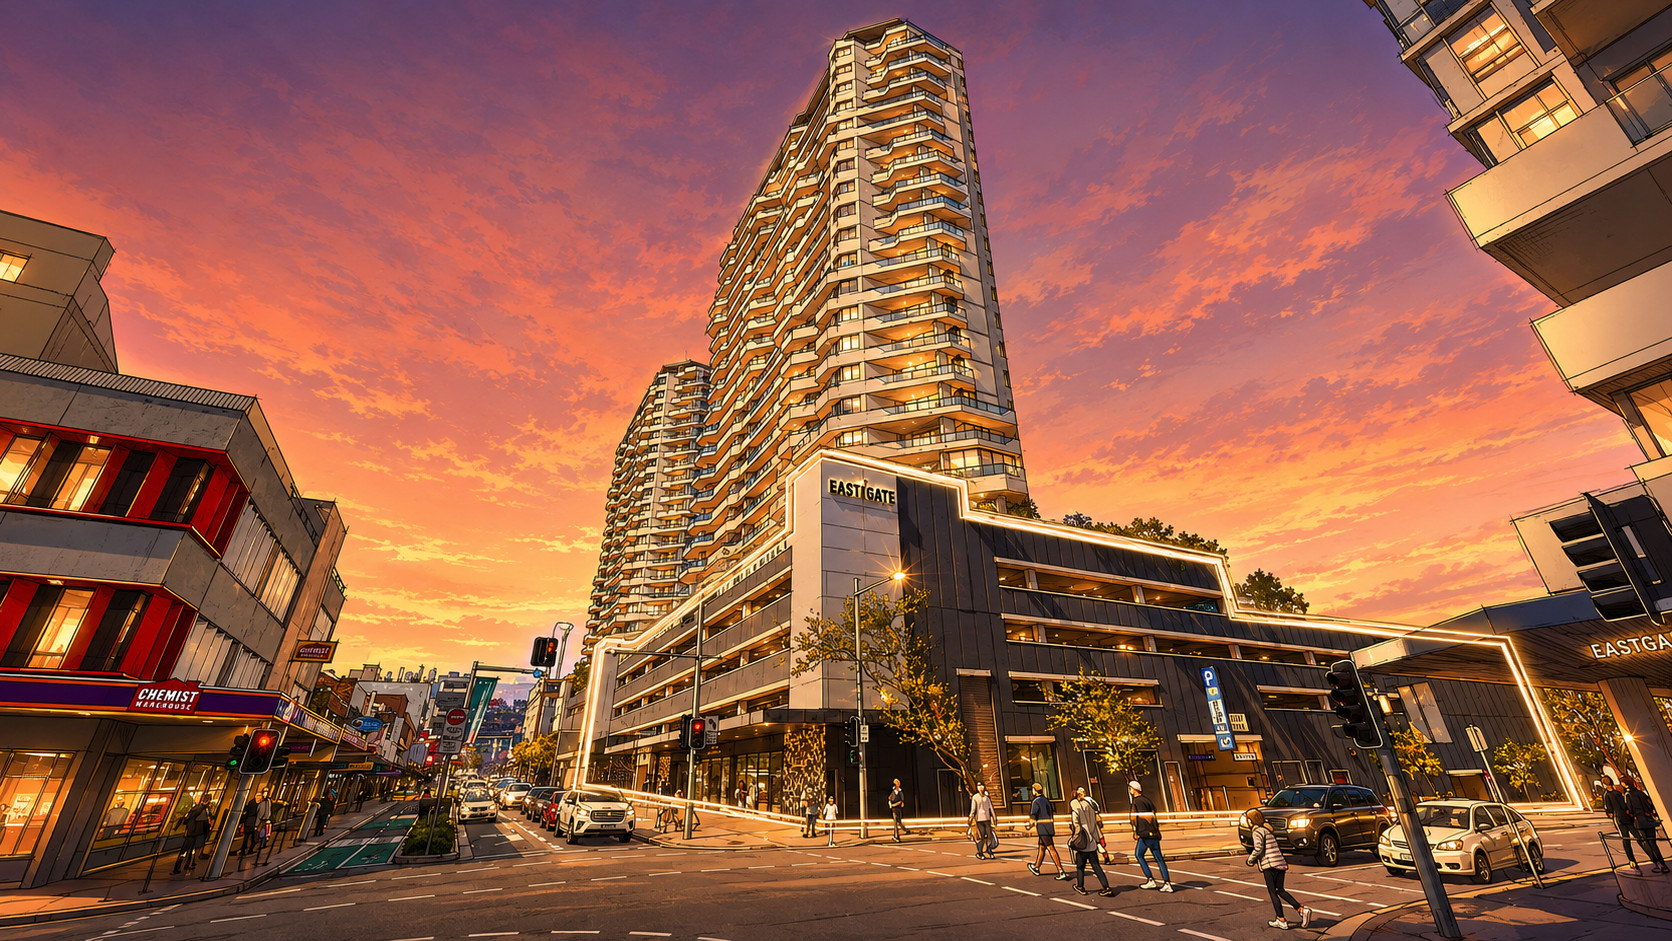
The biggest by a distance, and the oldest. One hundred and eight sales run from $700,000 to $5,600,000, median $1,610,000. Because the apartment numbers encode the floor, this is the one building of the three where height can be tested directly — and the answer is that above level 15 it stops paying. Position on the floor plate matters far more. Full study: Height is not the premium.
The ranges, side by side
Here is every building drawn on the same axis — the bar runs from its lowest recorded sale to its highest, with the median marked.
Sources: title exports for SP65372, SP50442 and SP31023, Bondi Junction. See methodology for exclusions applied to each dataset.
Read left to right and the three bars start in much the same place — every building has apartments trading between $700,000 and $920,000. It is the right-hand end that separates them. Eclipse stops at $2,850,000. The Oscar runs to $4,800,000. Eastgate Gardens reaches $5,600,000.
Notice too where the median sits in each bar. In every case it is well left of centre, which is what you would expect: a small number of large, well-positioned apartments pull the top of the range a long way without moving the middle. But the distance from the median to the top grows sharply with the size of the scheme.
The pattern
Express each building’s range as a multiple — highest sale divided by lowest — and the relationship with scheme size is hard to miss.
Spread is the highest recorded sale divided by the lowest. Lot counts are the total size of each strata scheme, not the number of sales analysed.
Three points do not make a law, and I would not want this read as one. But the mechanism behind it is not mysterious. A bigger building holds more product types — more aspects, more floor plate positions, more apartment sizes, more variation in how long each has gone without a renovation. Every one of those adds width to the range. A small building with a consistent floor plate has fewer ways to differ.
Scale does not make a building’s median more reliable. It makes it less.
What each building actually sells
The spread multiple describes the extremes. This describes the bulk — where the sales actually land.
Eclipse percentages are derived from published band counts across 33 sales; Oscar and Eastgate figures are computed from the underlying registers.
This is the chart I would put in front of an owner. Eclipse is effectively a single-product building: ninety-four per cent of its recorded sales sit under $1.5 million, and its median genuinely describes the typical apartment. The Oscar is two products — a large sub-$1.5 million cohort and an almost equally large $1.5 to $2.5 million cohort, with the median sitting in the seam between them, describing neither well.
Eastgate Gardens is three. Nearly half its sales are under $1.5 million, more than a third sit in the middle, and a genuine prestige tier of seventeen per cent trades above $2.5 million. A single median across those three groups is not a summary. It is an average of things that have nothing to do with one another.
Side by side
| Eclipse | The Oscar | Eastgate Gardens | |
|---|---|---|---|
| Address | 1 Adelaide Street | 2A Hollywood Ave & 18-34 Waverley St | 71-85 Spring Street |
| Strata plan | SP65372 | SP50442 | SP31023 |
| Completed | 2001 | 1995 | Earliest of the three |
| Developer | Walker Corporation | Meriton | Not confirmed |
| Scheme size | 87 lots | approx. 185 lots | approx. 285 lots |
| Sales analysed | 33 | 59 | 108 |
| Median | $1,105,000 | $1,420,000 | $1,610,000 |
| Lowest | $920,000 | $800,000 | $700,000 |
| Highest | $2,850,000 | $4,800,000 | $5,600,000 |
| Spread | 3.1× | 6.0× | 8.0× |
| Under $1.5m | 94% | 54% | 47% |
| Above $2.5m | 3% | 5% | 17% |
| What drives price | The taper above level 11 | Aspect, level, condition | Position on the floor plate |
What this means if you own in one of them
In an 87-lot scheme with a consistent floor plate, the building median is a reasonable opening position. In a 285-lot scheme it is a number that sits between three separate markets and belongs to none of them. Same statistic, entirely different reliability.
At Eclipse it is the apartments on your side of the taper. At The Oscar it is the ones with your aspect and your parking arrangement. At Eastgate Gardens it is your line — the apartments directly above and below you, sharing your outlook. In each case that is a handful of sales, not the whole building, and certainly not the suburb.
The $4,800,000 result at The Oscar and the $5,600,000 results at Eastgate Gardens are not ordinary apartments that sold unusually well. They are reconfigured, amalgamated or upper-tower stock that a suburb median has never described and never will. If you own one, no automated estimate is going to find you.
Two hundred sales, three towers, and not one useful number that covers all of them.
The honest limits of this
None of the three registers carries transaction dates. That means everything above describes the shape of these buildings rather than the state of the market today, and no growth rate, hold period or trend can be drawn from any of it. I have said the same in each individual study and I will keep saying it until I have the dated repeat-sales record to work from.
Nor do I have floor areas or bedroom counts. The strong suspicion at every one of these buildings is that the price spread is substantially a size story wearing an aspect costume — the larger apartments tend to occupy the better positions. Separating the two properly needs data I do not yet have.
And three buildings is three buildings. The relationship between scheme size and internal spread is clear in this sample and consistent with how these buildings are actually built, but it is an observation, not a proven rule.
Weiss Real Estate
I read the sales in your own line, your own aspect and your own tier before I read the suburb — and in a building of any size, that is the only reading that means anything. If you own at Eclipse, The Oscar or Eastgate Gardens, I am happy to sit down and go through where your apartment actually sits.
Methodology. Eclipse: 33 recorded apartment transfers, strata plan SP65372, common property lot excluded; figures as published in the Eclipse building study. The Oscar: 64 supplied records under SP50442, less one commercial retail lot, one undisclosed price and three records carrying other strata plans, leaving 59 sales. Eastgate Gardens: 122 supplied records under SP31023, less 14 duplicate entries against a secondary lot series, leaving 108 sales. Scheme sizes are the total strata lots in each plan — 87 confirmed for Eclipse, approximately 185 for The Oscar, and approximately 285 for Eastgate Gardens inferred from the highest lot number observed in the register. Eclipse bracket percentages are derived from published band counts; Oscar and Eastgate percentages are computed from the underlying registers. No register carries transaction dates, floor areas or bedroom counts, so no growth rate, hold period, price per square metre or bedroom-level figure has been calculated or implied. Completion dates for The Oscar and Eclipse are as published; Eastgate Gardens is described as the earliest of the three on the basis of its strata plan sequence, which is an inference and should be confirmed against the strata roll.
The relationship between scheme size and internal price spread described in this article is Alan Weiss’s own professional observation drawn from three buildings, not a sourced or statistically tested finding. This article is general commentary on the Eastern Suburbs property market and does not take account of any individual’s circumstances, objectives or financial position. It is not financial, legal or investment advice. Property values move, and past sales are not a reliable indicator of future results. Alan Weiss, Weiss Real Estate — Licence 218396, independent contractor for eXp Australia.